


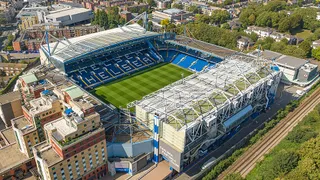
The clubs of the 2026/27 season, compared match by match from HerPitchData match sheets. 42 completed official matches counted.
Stadium map
Stadiums used this season and declared home grounds.
The stadiums
Stadiums where clubs played home matches this season.
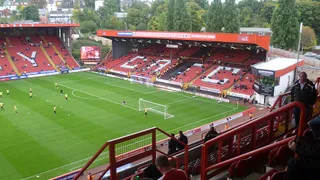 The ValleyLondon · Opened 1919 · Natural grass
- Capacity
- 27,111
- Matches hosted
- 4
- Average
- 2,131
 Academy StadiumManchester · Opened 2014 · Natural grass
- Capacity
- 4,998
- Matches hosted
- 3
- Average
- 3,179
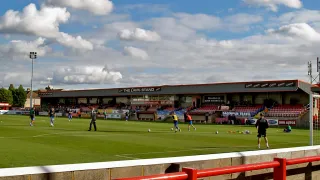 Chigwell Construction StadiumDagenham · Opened 1917 · Natural grass
- Capacity
- 6,078
- Matches hosted
- 3
- Average
- 1,641
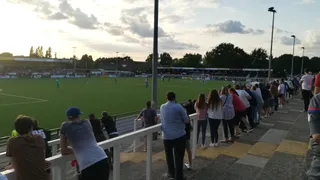 Copperjax Community StadiumLondon · Opened 1938 · Natural grass
- Capacity
- 6,100
- Matches hosted
- 3
- Average
- 4,541
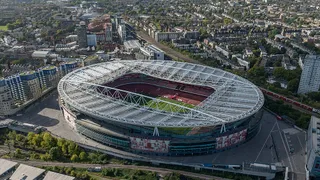
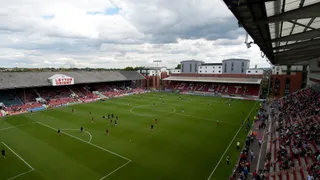 The BetWright StadiumLondon · Opened 1890 · Natural grass
- Capacity
- 9,271
- Matches hosted
- 3
- Average
- 1,697
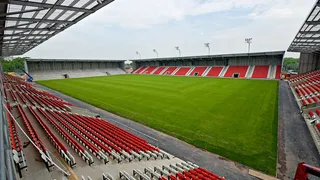 The Progress With Unity StadiumLeigh · Opened 2008 · Natural grass
- Capacity
- 12,000
- Matches hosted
- 3
- Average
- 3,567
 Falmer StadiumSussex · Opened 2011 · Natural grass
- Capacity
- 32,500
- Matches hosted
- 2
- Average
- 2,801
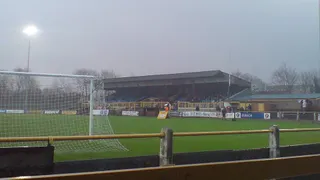 Gander Green LaneSutton · Opened 1912 · Natural grass
- Capacity
- 7,032
- Matches hosted
- 2
- Average
- 1,274
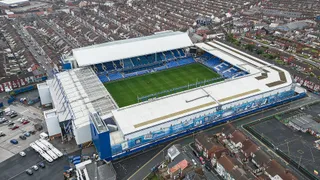 Goodison ParkLiverpool · Opened 1892 · Natural grass
- Capacity
- 39,414
- Matches hosted
- 2
- Average
- 1,830
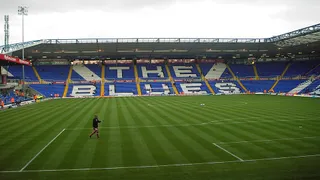 St Andrew's @ Knighthead ParkBirmingham · Opened 1906 · Natural grass
- Capacity
- 28,754
- Matches hosted
- 2
- Average
- 1,516
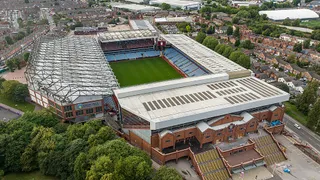
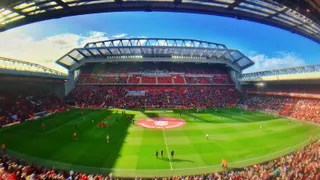
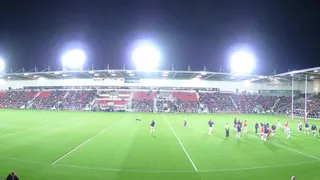 BrewDog StadiumSt Helens · Opened 2011 · Natural grass
- Capacity
- 18,000
- Matches hosted
- 1
- Average
- 2,293
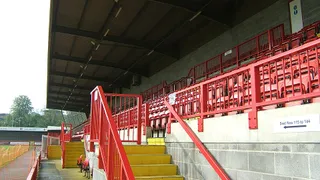
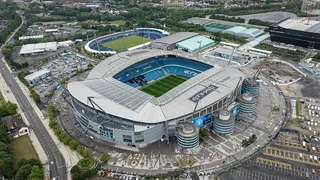 Etihad StadiumManchester · Opened 2002 · Natural grassAlternative venue
- Capacity
- 61,038
- Matches hosted
- 1
- Average
- 12,360
 Keys ParkHednesford · Opened 1995 · Natural grassAlternative venue
- Capacity
- 6,029
- Matches hosted
- 1
- Average
- —
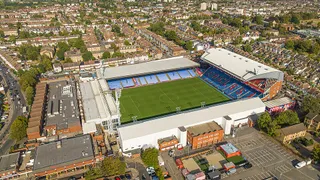 Selhurst ParkLondon · Opened 1924 · Natural grassAlternative venue
- Capacity
- 25,194
- Matches hosted
- 1
- Average
- 3,047


Home attendance
A missing attendance figure is never counted as zero.
| Matches | ||||||
|---|---|---|---|---|---|---|
| Arsenal | 24,393 | 23,900 | 73,179 | 29,853 · 19 Sept | 40% | 3/3 documented |
| Chelsea | 9,964 | 7,857 | 39,856 | 19,349 · 27 Sept | 25% | 4/4 documented |
| Manchester City | 6,239 | 3,216 | 18,717 | 12,360 · 4 Oct | 49% | 3/4 documented |
| Liverpool | 5,968 | 5,968 | 11,935 | 9,642 · 27 Sept | 14% | 2/2 documented |
| London City Lionesses | 4,541 | 4,177 | 13,623 | 5,402 · 4 Sept | 74% | 3/3 documented |
| Manchester United | 3,567 | 3,416 | 10,702 | 4,327 · 13 Sept | 30% | 3/3 documented |
| Brighton & Hove Albion | 3,235 | 3,137 | 9,706 | 4,104 · 6 Sept | 30% | 3/3 documented |
| Aston Villa | 2,516 | 2,516 | 5,032 | 3,079 · 13 Sept | 6% | 2/3 documented |
| Crystal Palace FC | 2,161 | 2,161 | 4,321 | 3,047 · 20 Sept | 15% | 2/3 documented |
| Charlton Athletic | 2,131 | 2,149 | 8,524 | 2,340 · 18 Oct | 8% | 4/4 documented |
| Everton | 1,830 | 1,830 | 3,659 | 2,026 · 4 Oct | 5% | 2/2 documented |
| Tottenham Hotspur | 1,697 | 1,675 | 5,090 | 2,377 · 4 Oct | 18% | 3/3 documented |
| West Ham United | 1,641 | 1,638 | 4,923 | 2,185 · 4 Oct | 27% | 3/3 documented |
| Birmingham City | 1,516 | 1,516 | 3,032 | 1,627 · 27 Sept | 5% | 2/2 documented |
Fill rate on matches with both attendance and stadium capacity known.
Average attendance in the competition
by matchday
| MD1 | 3,751 |
|---|---|
| MD2 | 5,468 |
| MD3 | 6,719 |
| MD4 | 5,848 |
| MD5 | 3,826 |
| MD6 | 7,353 |
39 of 42 matches documented
Highest attendances
A missing attendance figure is never counted as zero.